About Me
I'm an educational professional expanding my skills in data science and analytics - particularly python, SQL, machine learning and visualisation models. I've worked on a variety of projects ranging from support vector machines and predictive modeling, to web scraping and automation. I'm constantly learning and exploring new technologies to stay at the forefront of this rapidly evolving field.
When I'm not in front of a PC, I love exploring new film and TV, traveling, cooking, playing tennis and hiking. I also love tinkering with Unity projects and developing scripts to fulfil niche interests.
You can find me on GitHub and Kaggle.
Portfolio
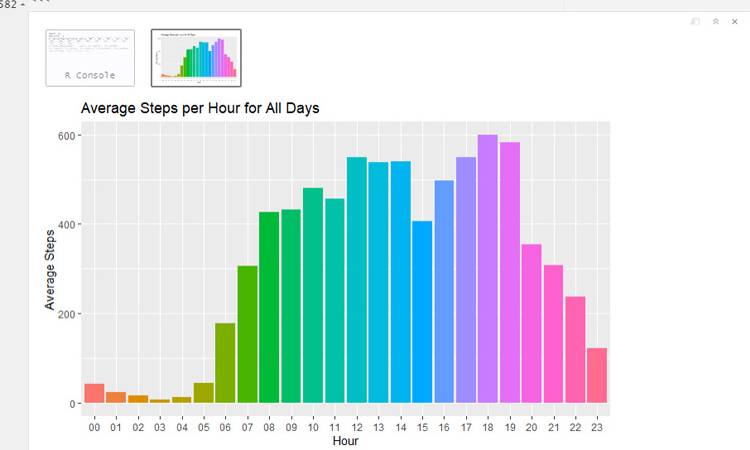
Health Benchmark Gap Analysis: Leveraging Fitbit Data for Bellabeat's Marketing Strategy
Analysed Fitbit user data to identify health behavior gaps against CDC and WHO recommendations. Found most users fall short of daily step, active minutes, and sleep targets. Recommended product features and marketing strategies for Bellabeat to address these gaps through notifications, social engagement, and targeted advertising focused on health benchmarks.
View on GitHub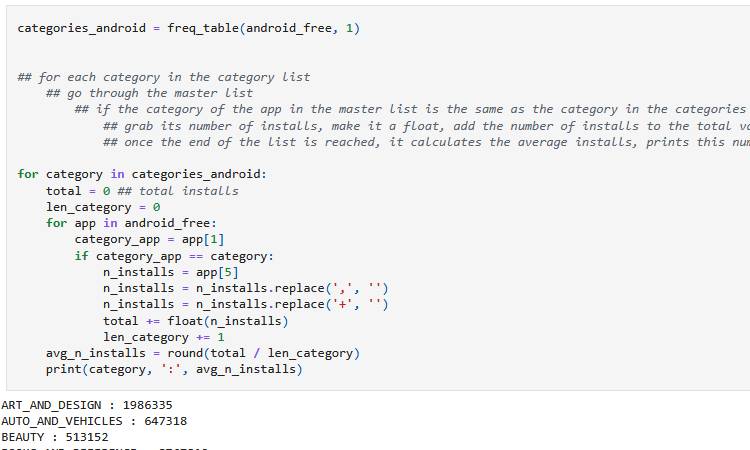
Market Gap Analysis: Identifying Profitable Mobile App Opportunities
Conducted comparative analysis of 17,000+ mobile apps across Google Play and App Store to identify underserved market segments. Discovered potential opportunity in iOS personalisation apps, an untapped category with high engagement on Android platforms. Provided strategic recommendations for app development to maximise user acquisition.
View on GitHub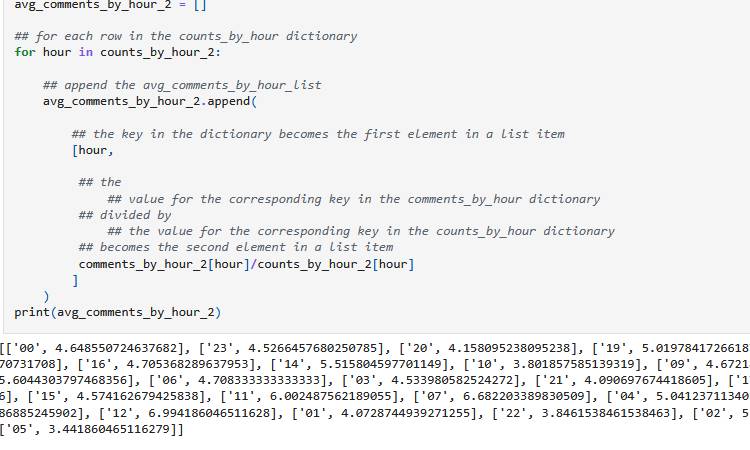
Optimising Engagement: Time Analysis of Hacker News Post Performance
Analysed Hacker News posts to determine optimal engagement strategies. Found 'Ask HN' posts receive twice as many comments as 'Show HN' posts, with peak engagement at 3PM for questions and 12PM for showcases. Insights help content creators maximise community interaction.
View on GitHub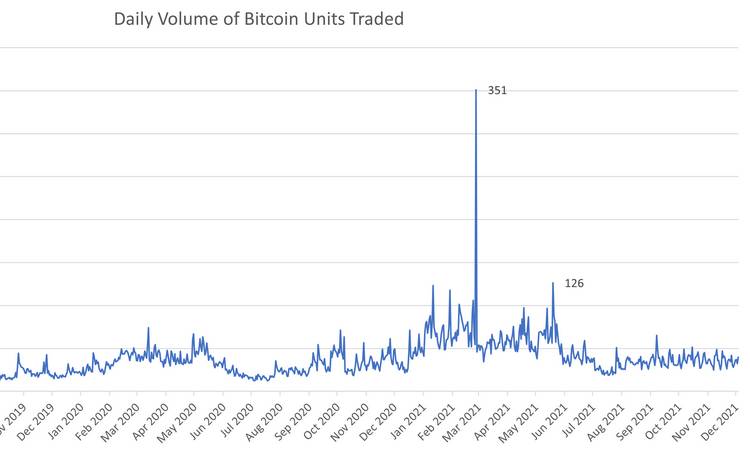
Bitcoin Market Dynamics: Visual Analysis of Price Volatility and Trading Patterns
Analysed three years of Bitcoin trading data to uncover price movement patterns and trading behavior. Discovered that Bitcoin is slightly more likely to increase in value day-to-day, with significant price volatility correlating to higher trading volumes. Identified a dramatic price surge period from November 2020 to April 2021, with no consistent seasonal trading patterns.
View on GitHub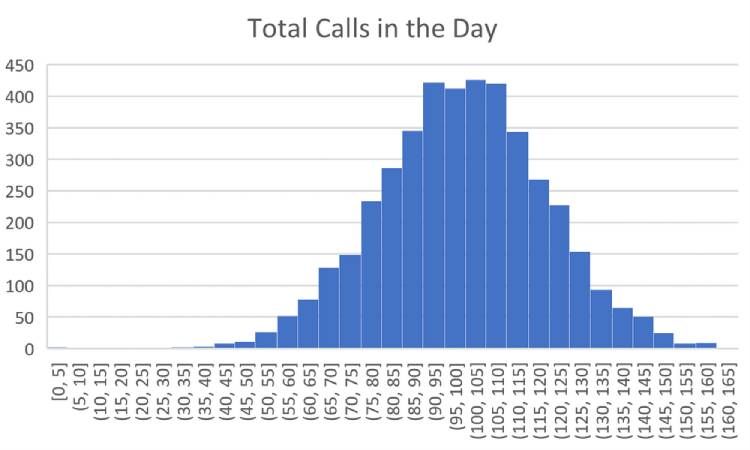
Telecom Churn Prediction: Identifying Key Customer Retention Factors
Analysed telecom customer data to identify churn risk indicators using statistical methods. Discovered significant relationships between churn and high day charges, lack of voicemail plans, and increased customer service calls. Found customers in NJ, MN, TX, MD, and WV had higher churn rates. Results enable targeted retention strategies for high-risk customer segments.
View on GitHub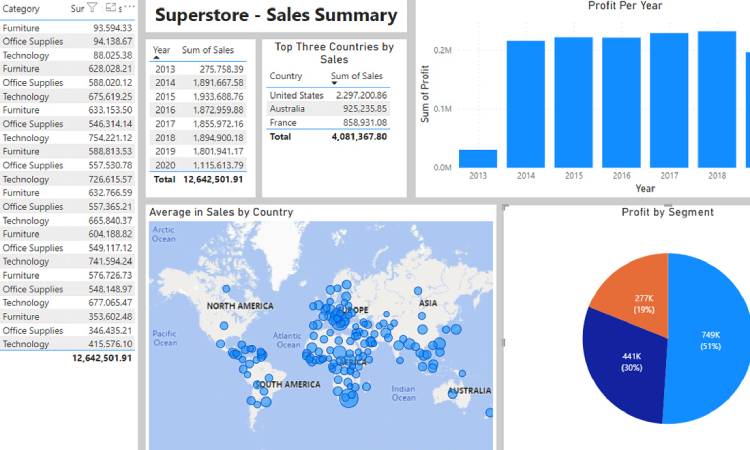
Global Retail Performance: Interactive Dashboard of Superstore Sales Metrics
Created an interactive Power BI dashboard to analyse $12.6M in global office supply sales across multiple markets. Identified the US, Australia, and France as top-performing countries, and revealed the Consumer segment as the most profitable ($749K). Dashboard enables year-by-year comparison and segment-based profit analysis.
View on GitHub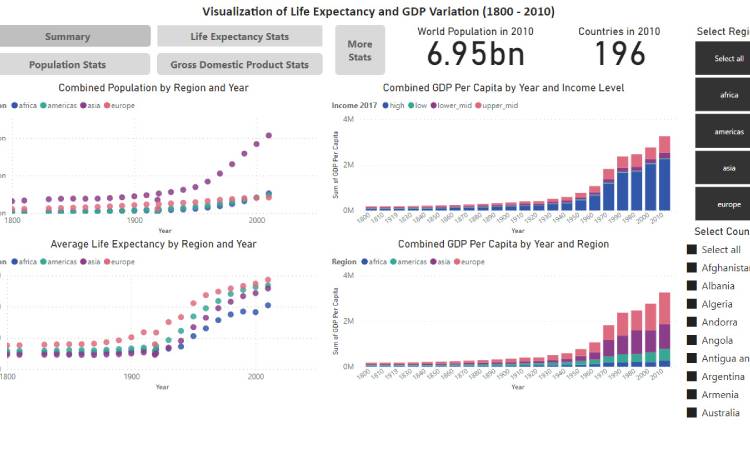
Global Development Patterns: 200 Years of Life Expectancy and Economic Growth
Created interactive visualistions tracking the relationship between life expectancy, GDP, and population across 200+ years of global data. Revealed distinct development patterns between regions and income classes, highlighting how economic growth correlates with health outcomes. Dashboard enables cross-country comparisons and identifies historical turning points in global development.
View on GitHubEducation
Master of Data Science
University of Newcastle
Statistical trial design, logistic regression, ANCOVA, and statistical analysis. Model evaluation and systematic review. Data security, management, privacy, ethics, and conduct. SAS, RDBM and Excel.
Graduate Certificate in Data Analytics
University of Newcastle
Total Quality Management. Systems thinking. Statistical process control, surveys and experimental design. Regression and ANOVA. Data modelling and visualisation. Data reporting. Data security, privacy and ethics. Excel and JMP.
Data Scientist in Python - Career Path
Dataquest
Object-oriented and functional programming with Python. Web scraping and SQL queries. Deep learning and machine learning. Predictive analysis.
View on GitHubBusiness Analyst with Power BI - Career Path
Dataquest
Data Analysis in Excel. Extracting and manipulating data using SQL. Descriptive statistical analysis. Dashboards and visualisations in Power BI.
View on GitHubData Analyst in Python - Career Path
Dataquest
Python fundamentals. Preparing and extracting data with SQL queries. Data visualisation. Descriptive and predictive statistics.
View on GitHubGoogle Data Analytics - Professional Certificate
Coursera
Collecting, cleaning, processing and analysing data. SQL queries. R programming. Creating data visualisations in Tableau. Presenting and reporting insight.
View on GitHubGraduate Diploma of Education
Macquarie University
Presentations and reporting. Curriculum design. Inclusive education. Management and collaboration.
Bachelor of Science
Macquarie University
Data collection and quality. Statistical models, regression & correlation. Sampling, hypothesis testing and errors. Excel and Minitab. Presentation and reporting.
Contact Me
I'm always open to discussing new projects, creative ideas, or opportunities to be part of your vision. Feel free to reach out directly via email.
Email: oxbbar@gmail.com